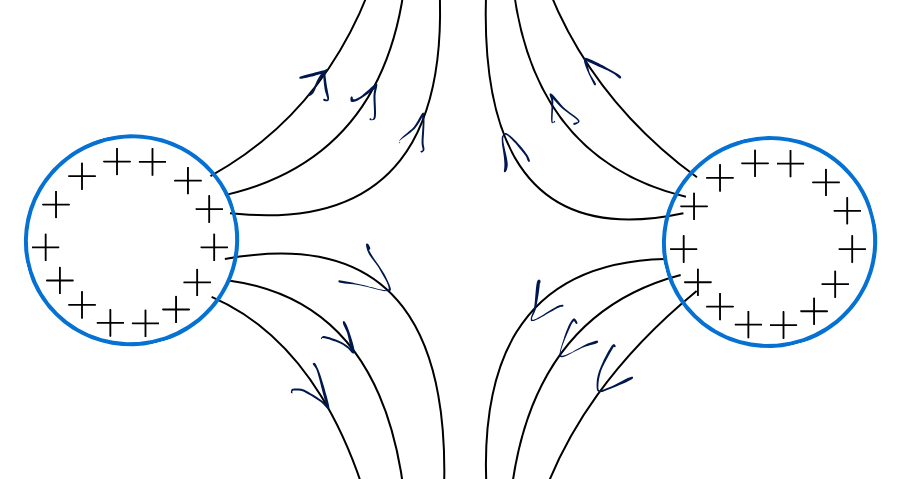
Hello friends, in this post we will talk about an important topic in electrotherapy. We will talk about the strength-duration curve, or SD curve. So, what is the purpose of the curve? In this post, I am going to explain this topic and make it as simple as possible.
Strength-duration curve
In simple terms, the strength-duration curve is the graph that we plot between the strength of galvanic stimulation and the duration of galvanic stimulation. Its purpose is to find out if our muscles have any peripheral nerve injury that can happen due to fracture or if there is any disease of peripheral neuropathy.
It helps us to locate which group of muscles has partial innervation, complete denervation or if it is simply normal. SD curve is the simplest way to find this.1
Step-by-step testing procedure & guidelines
How does this whole process work?
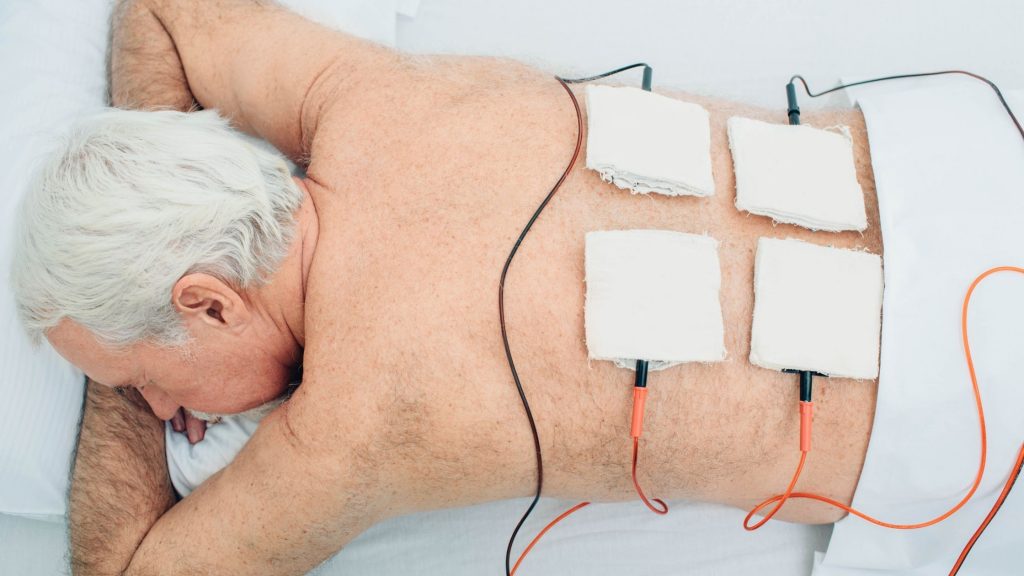
So, the first thing is that for the SD curve, we need a muscle stimulator machine. Along with this, make sure to take the SD curve only after 20 or 21 days following any nerve injury. This is because it takes 20 – 21 days for the nerve to regenerate or improve.
To measure the strength-duration curve, you need to follow a set of rules to get a better result.
- The most important thing is that whenever you place the electrodes, make sure to place them at the same particular point every time taking the stimulation
- You should watch for a minimal stimulation, a muscle flicker, that should be taken as muscle stimulation. And on that basis, you should take your reading.
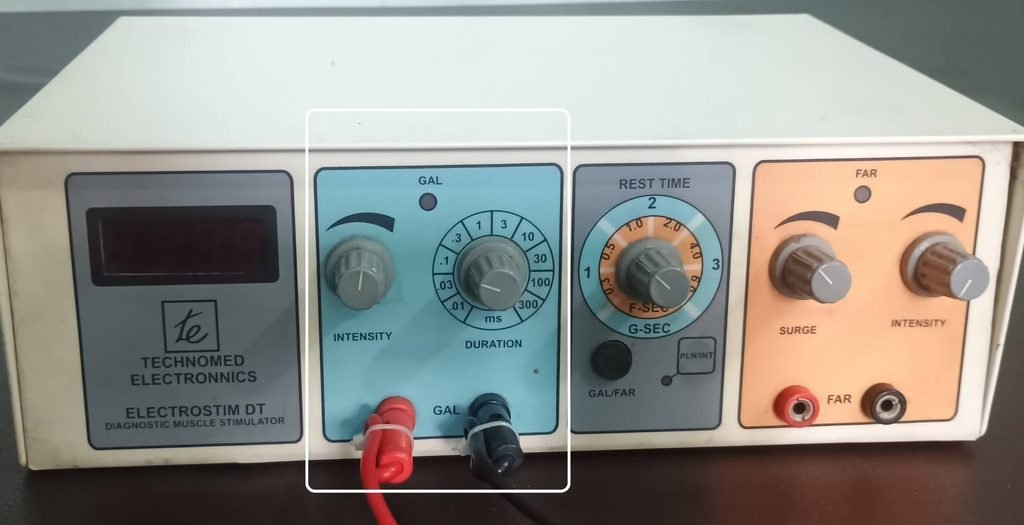
You can see a muscle stimulator with a galvanic on one side and faradic on the other. For the strength-duration curve, we will use this Galvanic current. You can see the duration knob with a gradation from 0.01 ms to 300 ms.
But for our graph and study, we will use durations up to 100 ms.
We will write these durations on our graph one by one. So the first is 0.01, then 0.03, then 0.1, 0.3, 1, 3, 10, 30, 100, this duration is in milliseconds. Every day we will progress to new durations, starting with the shortest duration first. As we progress, we will note how much strength is required at a particular duration to produce minimal muscle contraction.
As I have told you before, you should observe a visible muscle contraction, a flicker muscle contraction, at that intensity. We will note this intensity.
Let us try to understand the process with an example of wrist drop due to supracondylar fracture.
Clinical Case Study: SD Curve in Supracondylar Fractures
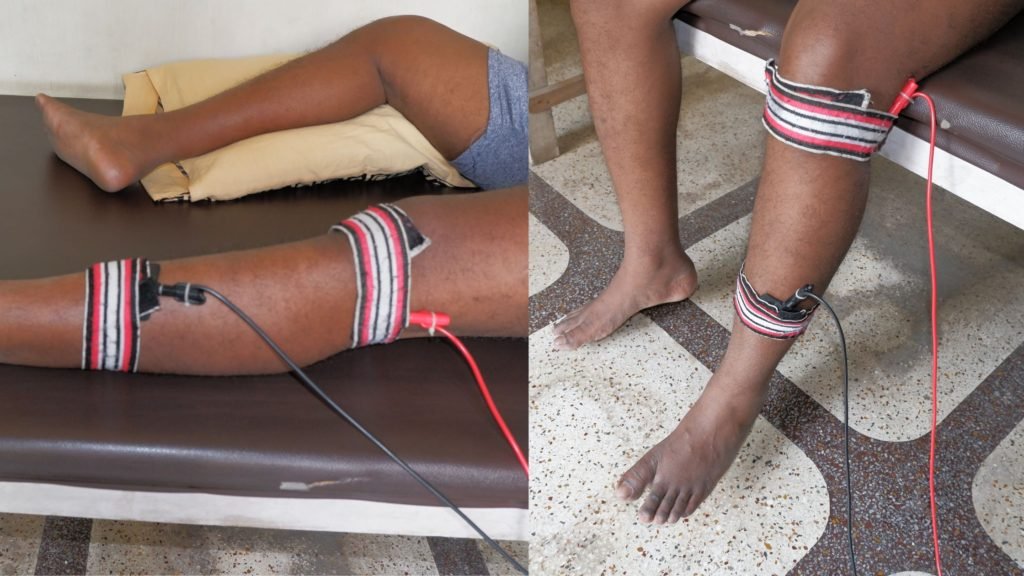
So let us take an example of a supracondylar fracture. A supracondylar fracture may cause radial nerve injury, which can cause wrist drop. So, for the SD curve for wrist drop, place one electrode at the common origin of the wrist extensors, and place a second electrode here.
Then we will set the duration to 0.01 ms and then slowly increase the Intensity of stimulation. At a particular intensity, we will be able to observe minimum contraction. We will simply note down that particular contraction intensity for a 0.01 ms duration.
The next day, we will again place electrodes at the same particular point. And we will progress with the next duration, that is 0.03 ms. Then we will increase its intensity, and the particular intensity at which the muscle simulations occur, we will note it down.
Similarly, we will measure intensity for each duration till we reach 100 ms. We will measure the strength, and we will note it down. Finally, we will use this data to give a graphical representation.
Graphical representation
1. Normally innervated muscle
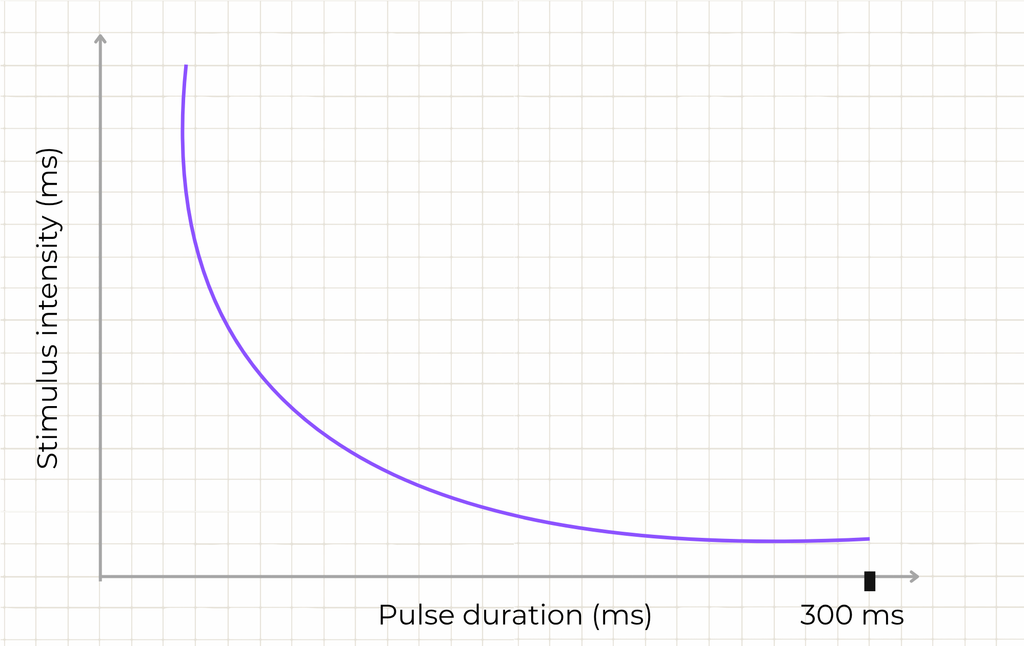
This graph represents the SD curve of a normally innervated muscle with completely normal nerve supply, or when the nerve supply is fully regenerated.
So you can see that at higher duration, less intensity is required. Short Duration requires higher intensity. As we go on, increasing the duration, less intensity is required.
2. Completely denervated muscle
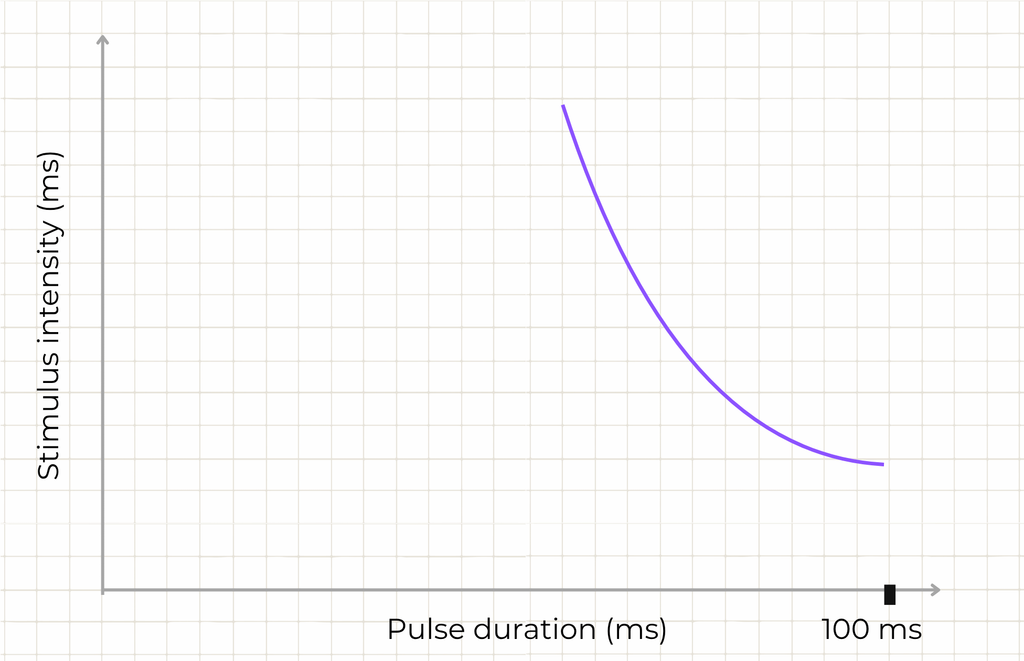
So, what will the graph be if plotted for denervated muscle, where there is complete disconnection of nerve supply? It can be due to a completely injured or completely cut nerve; it will give a different kind of graph.
This curve, as in the image, is of fully denervated muscle.
So what does it mean?
In short duration, whatever intensity we give is incapable of producing muscle contraction in those particular muscles. This is because it is fully denervated. As we go on increasing the duration, we will observe that at a particular duration, after a considerable increase in intensity, we get a slight contraction.
Then, as we increase the duration, we will get contractions at lower intensity. So, in denervated muscles, you will see a graph in which there is a big gap at lower duration and its strength, contrary to innervated muscle, in which contraction was observed right from the beginning of the duration.
For innervated muscles, in short duration, there was contraction but with higher intensity.
As we further progress with duration, the muscle stimulation was elicited with lesser intensity. This is because sometimes the nerve injury is partial, or we will call it partial innervated muscle.
3. Partially innervated muscle & the “Kink”

So how partial innervated muscle graph look like? Let’s try to understand
In partially innervated muscles, a few fibres have intact nerve supply. So here, the muscle fibres with nerve supply will produce contraction for a minimal duration.
As we increase the duration with less intensity, we will get contraction. After that, a point will come where both the denervated and the innervated muscles, in that particular duration we will be stimulated.
There will be two curves, one for only innervated fibres, and the other for both innervated and denervated fibres together. The point at which both the curve meets is called KINK. Suppose it is a partially innervated muscle, but slowly, after improvement, 70% of muscle fibres are back with nerve supply; it has become innervated.
In such a case, the position of the kink will be slightly on this side. In that case, the curve will be of this type, okay, that is, the kink is shifted a little this way.
But suppose most of the fibres are still denervated, ie in 70% of the fibres there is still no nerve supply; only 30% of the fibres have supply, then this kink will shift to this side. So this is how the graph will be formed.
Beyond identifying the kink, the strength-duration curve also gives us two specific reference values that we can read directly off its shape: rheobase and chronaxie.
Rheobase and chronaxie

Rheobase is an intensity, and chronaxie is a duration2. These two points let us describe a muscle’s excitability with a single number each, instead of the whole curve, which is useful for comparing results over time as a nerve recovers.
Rheobase is the minimal intensity that is required to produce a contraction. Now, according to the graph, this minimal strength has unlimited duration; here, duration is not taken into account; duration is infinite.
Next is chronaxie. So, let me define it: chronaxie is the duration at which double the intensity of the rheobase contraction is produced.
FAQ
If we double the intensity of the rheobase, then make a line from here; the duration at which it falls- this particular duration we call it chronaxie.
The SD curve is a graph plotted between strength (intensity) and duration, used to assess whether a muscle’s nerve supply is normal, partially denervated, or completely denervated after an injury such as a fracture or peripheral neuropathy.

The author is a physiotherapist who has been practising for the last 17 years. He holds a Bachelor's in Physiotherapy (BPT) from SVNIRTAR (Swami Vivekananda National Institute of Rehabilitation and Research), one of the prestigious physiotherapy schools in India.
Whatever he learns dealing with his patient, he shares it with the world through blogs and e-books. He also owns a YouTube channel, "Sunit Physiotherapist" with over 8 lakh active subscribers. Here, he shares everything he gets to learn serving the patient.